One's personality is both a composition and reflection, but if I have to choose one of them, I will choose reflection as the "self" is more important to me than "me". One's composition may change, walking across the cultural landscapes and climbing the social ladder but one's self is tied to one's reflections. The fun part is that reflections are not bound to "Time-Space" barriers ( it is not time-space) and respective mental constructs, which have grown so thick over ages, that they had reduced the image of humans to Sisyphus, rolling different sizes of boulders on hills of different heights.… As the name of this Blog indicates, knols are my perspectives on topics of interests, sweet/bitter experiences or just doodling :)

Tuesday, January 10, 2012

Some recent approaches in Recirculation aquaculture system to sustain water quality and increase food production

Introduction:

In recent decades several factors have changed the practices of aquaculture drastically to change it from small scale homestead activities to large scale commercial farming. The decrease in consumption of meat and egg and increase in consumption of fish and legume per capita from one side and increased regulatory pressure focusing on the discharge to natural water bodies are forcing aquaculture industry for more innovative approaches. One of the growing fields in aquaculture both in terms of research and commercial activities is Recirculatory Aquaculture System (RAS). But there are big challenges that RAS is facing like, limitations in quality and quantity of water, availability and cost of land and limitations on water discharge and natural environmental impacts. Besides these another major challenge for RAS is increasing costs of energy for heating and pumping.

This paper will present an overview of some basic research areas like manipulation of species adapted to cold water like arctic char, mutualism of which with phytoplankton like Tilapia and Chlorella and the challenges that RAS is facing in internal treatments of contaminants. RAS is using the knowledge of ecosystems in internal treatments of contaminants by manipulating nitrifying bacteria to make RAS a sustainable aquaculture practice by increasing in production but with lesser costs and more environmental friendlier practices.

Table of Contents

1. Recirculatory Aquaculture System (RAS)
2. Arctic char
3. Manipulating mutualism between West African Tilapia and Chlorella in warm water RAS
4. Biological filters
5. References

1. Recirculatory Aquaculture System (RAS):

RAS is a set of approaching in fish farming which use a closed-loop system that retain, treat and reuse the water. The main objective is to preserve the water the water quality and minimize the nutrient pollutants. RAS is mainly composed of a growing tank, Tank of particulate removal device, biofilter, oxygen injection with U-tube aeration and water circulating pump. The water start flowing from growing tank and after passing treatment components return back to the growing tank and due to this circulation of water this closed-loop, it is called Recirculatory Aquaculture System. To get more from this system some RAS, grow herbs and vegetables in nutrient rich water. Vegetables uptake of nutrients from water not only helps in their rapid growth but also in filtration of water. This practice is called aquaponics as contrasting to hydroponics.

Image Source:

http://www.christoutreachministrieshonduras.org/images/2005ViewsAquaponics.jpg
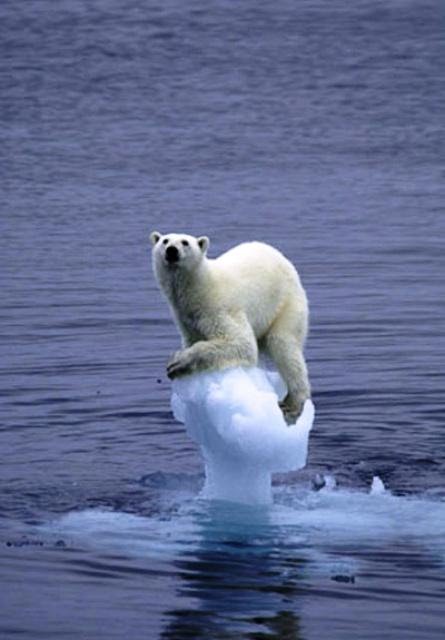
2. Arctic char:

The natural home of Arctic char is Scandinavian countries and it is fished in Siberia, Iceland, Greenland, Norway and northern Canada. In northern countries listed above the wild char is fished and there are also extensive aquacultures of char in these countries. Arctic char is well known for its adaptation of cold water and it is the only fish species in the Lake Hazen that is commonly thought of as the Northern most Lake of Canada, though smaller lakes are present further north. The Arctic Char live both in fresh water and sea water. Based on living habitats, Arctic Char is of two basic types. First type lives in fresh water in winter and migrates to sea in summer to feed. The second types is live totally in fresh water and do not migrate. Arctic Char store food during summer feeding and use these stored fat by feeding very less during winter.

The farming of Arctic Char is dominated the fresh water production of fish in Nordic countries. There are several factors that make char a preferred fish in cold water regions. Char is considered as the most cold adapted species within Salmonid family (Johnson, 1980). Char have excellent fillet yield, tolerate high density culture conditions, amenable to niche marketing and are suitable for production within super-intensive Recirculatory system (Jobling, 1987, Johnston, 2002, Summerfelt et al., 2004 a, b.)

Despite the mentioned characteristics of char, the seasonal changes in growth rates of char are a real concern in farming of char. In autumn the growth rate of wild char drops (It is known as autumn depression), so it is a problem for those char farmers who catch wild char and farm them to marketable sizes. In contrast to wild char, hatchery-produced char didn’t show seasonal changes in their growth rates.

To test this observation Sten and his colleagues in Nofima (The Norwegian Institute of Food, Fisheries and Aquaculture Research) has compared the growth performance of wild and hatchery-produced char in a commercial coldwater recirculation system (Villmarksfisk, Bardu, 688N, 198E, Norway). They reared both hatchery-produced char and wild char for 240 days by measuring length and weight of sampled fishes at intervals of 0, 40, 90, 150, 200 and 240 days. The hatchery-produced fishes were taken from Sjoblink Blokken hatchery facility and Wild char is caught from Lake Altevan in Bardu. The initial body mass of char fishes were 115 gram. Two weeks before start of experiments 240 char comprising of 120 wild char and 120 hatchery-produced char were anesthetized and tagged. Similarly, Wild char is weaned to dry feed during two weeks prior to experiments by adding 10% cod roe at day first and gradually reducing to zero at the day 14. The tagged fishes were then randomly distributed among four 2000 L fiberglass tanks, two tanks per group each holding 60 tagged and 240 untagged fish. All the fish were reared under identical condition at a mean temperature of 9.2 8C and on continuous light (150 lx).

The results indicated that there was no much difference till day 40 between wild and hatchery produced char but at day of 90, there was sharp difference between wild and hatchery produced char. The difference between growth rates continues till end of experiments at day 240, in which hatchery produced char gained a weight of 451 as compared to 231 g of wild char. Besides the growth differences the mortality rates are also showed significant differences. The mortality rate in hatchery produced char was 4% as compared to 42% of that of wild char. The result of the this study by Sten clearly show that the superiority of hatchery produced char as compared to wild char both in terms of weight gains and less mortality. Hatchery-produced char would certainly a better choice for cold water RAS.

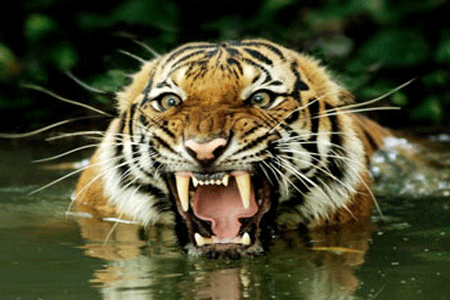
3. Manipulating mutualism between West African Tilapia and Chlorella in warm water RAS;

Following carp, Tilapia is the second as most important farmed fish in the world. Tilapia is an omnivore, with high growth rate, high resistant to diseases, tolerant to low oxygen levels, live in diverse range of salinities and could be cultured in different density levels. These characteristics along its palatability make it a fish of choice for fish farming. Tilapia is a common name used for many cichlid species of three genera, Oreochromis, Sarotherodon, and Tilapia (Watanabe et al. 2002). Tilapia live mostly in fresh water but due to its tolerance for diverse salinity it shows a diverse range of habitats like, stream, rivers, ponds, lakes and estuaries. Two disadvantage of Tilapia are warm water habitat and self-reproducing populations. As Tilapia can’t survive in cold waters below 16 degree Celsius so it is a limiting factor for its farming in temperate areas. Tilapia’s juveniles matures at six months but spawning occurs year-around. Males grow faster and larger in sizes as females use energy for reproduction and mature earlier. Due year-round spawning and high tolerance they become invasive species in warm waters.

Although Tilapia is an omnivore fish and can adapt to any food available but it mainly feed on the phytoplankton and benthic alga. In closed fish farming like RAS the removal of ammonia excreted by fish is a challenge. On other hand availability of CO2 in Chlorella algae is limiting factor for it. Phytoplankton based RAS is one of the current eco-technological solution. In such a RAS, Tilapia fish could be benefited by feeding on Chlorella as well as by removal of ammonia and oxygenation of water by their photosynthesis. Similarly, Chlorella could be benefited from Co2 produced by Tilapia’s respiration as well as cleaning its environments by their filter feeding habits.

To analyze the practical advantage this mutualism in warm water RAS, Sylvain Gilles and his colleagues at IRD, Senegal, conducted an experiment. The experiment duration was 24 hours, in which 36 tubs filled with filtered water (to remove rotifers) from a phytoplankton pond is used. The tubs were arranged in two rows in a greenhouse to avoid dilution and contamination by rainwater and other falling particles.

Fishless Unfed Fishes Fed Fishes
A graphical presentation of the arrangements of tubs and treatments of the tubs with fish and Chlorella

A 3-level trilapia treatment (C, fishless control: F, Unfed fish and Ff, Fed fish) with four-level Chlorella treatment (With 10%, 50%, 80% and 100% of routine algal density in the prototype “phytoplankton RAS or recycle pond”) was conducted. To achieve initial Chlorella density, prototype water (Salinity 15 g/L, 100% algal density = 33 x 10 6 cells mL -1 ) was mixed with a water from a well dug 30 m from ocean shoreline (Same salinity but no phytoplankton).
The 24 female tilapia which were starved for 24 hours, prior to start of experiment were distributed in 24 of 36 tubs. Only fed fish got a single 2 gram ration in pellets of 1.5 mm. The phytoplankton were sampled successively just in half hour of start of experiment (8:30), in 2 hours (10:00), in 6 hours (14:00), in 12 hours (20:00) and in 24 hours (8:00, next morning). The samples collected in first half an hour of were experiment was taken as a mean density of chlorella. Samples were collected at mid depth with 30-mL container and phytoplankton immediately fixed by adding a 3 drops of 4% of formaldehyde.

Chlorella concentrations were determined by colorimetry with a Hanna C203 photometer and counts were performed using a Burker cell under an OLYMPUS CX41 stereomicroscope (40X magnification).
The result of experiment showed that the density of Chlorella decreased in fishless tubs at lowest and highest initial Chlorella densities respectively. Compared to fishless tubs, the tubs with unfed fish shown an increase in Chlorella density. Similarly, fed fish tubs showed more increase in density than unfed fish tubs. Beside an increase in algal density from fishless to unfed fish and fed fish tubs, the initial density of Chlorella is also affected the resulting Chlorella. Higher initial densities resulted in higher Algal densities. Researchers in this experiment concluded that this mutualism between Tilapia not only can be manipulated in mass production in photosynthetic suspended-growth systems but can also be used for treatment of wastewater.

4. Biological filters:

The wastes in effluent are a major problem in aquaculture. Wu for example estimated that 85% of phosphorus, 80-88% carbon and 52 -95% of nitrogen of mass feed will end up as particulate matter, dissolved chemicals and gases (Wu, 1995). On other hand RAS technology can reduce the effluent waste stream by a factor of 500-1000 (Chen et al., 1997: Timmons et al., 2001). RAS technologies use biofilters to treat internally the dissolved ammonia and other dissolved organics and greatly reduces the amount of water use as well as discharge from aquaculture operations.

Biofilters are mediums for bacteria to colonize and remove unwanted dissolved gases and organic content. Biofilters are for different purposes like improve air quality, improving water quality and waste water managements. In aquaculture biofilters are used to convert ammonia to nitrites and nitrite into nitrate and oxidize organic matter. For this purpose the bacteria medium requires oxygen to continue nitrification process. In RAS, there are two types of biofilters are used. Fixed biofilms, in which bacteria is provided a fixed substrate to colonize and grow. In contrast, there are also suspensions biofilters in which bacteria is maintained suspended.
Although RAS is an environmental friendly technology but its operational costs are higher than pond or flow through systems so currently it is more feasible for higher priced fishes like fingerlings and bloodstock. Increasing efficiency of biofilters is key in making them more cost competitive. Maria Teresa Gutierrez-Wing and Ronald F. Malone have summarized a few suggestions in their paper that is based partially on ideas come of the discussions that took place at Workshop Design and Selection of Biological Filters for Freshwater and Marine Applications held in Honolulu, Hawaii on 8-11 November 2004, hosted by Oceanic Institute’s Aquaculture Interchange Program under leadership of Dr. Cheng-Sheng Lee. Notable suggestions by authors are listed as,
Though suspended growth systems is less favored to fixed film systems due to poor water quality however to meet economic expectations force the aquaculture community to revalidate the suspended biofilters especially for hardy species or fishes with high levels of tolerance for contaminations and low oxygen levels. Waste water managements have developed more efficient biofilters like MBBR (Moving bed biofilm reactors) and BAF (Biological aerated filters). These biofilters have started to be introduced into RAS and it is needed that the introductions of these new biofilters should be compared and evaluated with currently used biofilters and in RAS. Two factors of marine species make them attractive for RAS. The first is the high demand for reliable supply of marine species as sea bass, sea bream, flatfish and cobia (Schwarz et al., 2004) and their higher market prices make them an attractive niche for RAS. The second is the demand of marine larval systems for ultraoligotrophic category of water (maximum oligotrophic category for fresh water and fingerlings are set 0.3 mg N/L and marine larval systems requires TAN concentration below 0.1 mg/L) and sensitivity to feed sizes in different stages of developments. For example, larvae of the shrimp have three distinctive stages of growth, nauplius, zoea and mysis and each of them requiring different feeding regimes and very high quality water, as they are very sensitive to suspended solids, and bacterial infections.

References

1- Atanabe, W. O., T. M. Losordo, K. Fitzsimmons, and F. Hanley. 2002. Tilapia production systems in the Americas: Technological advances, trends, and challenges. Reviews in Fisheries Science 10:465-498.

2- Alon Singer, Shmuel Parnes, Amit Gross, Amir Sagi, Asher Brenner, A novel approach to denitrification processes in a zero-discharge recirculating system for small-scale urban aquaculture, Pages 72-77
3- FAO. © 2003-2009. Fisheries Topics: Technology. Fisheries technology. In: FAO Fisheries and Aquaculture Department [online]. Rome. Updated 2006 15 09. [Cited 20 October 2009]. http://www.fao.org/fishery/sofia/en
4- Hamlin, HJ; MichaelS, JT; Beaulaton, CM; Graham, WF; Dutt, W; Steinbach, P; Losordo, TM; Schrader, KK; Main, KL. Comparing denitrification rates and carbon sources in commercial scale upflow denitrification biological filters in aquaculture. Aquacultural Engineering. 2008; 38(2): 79-92.
5- Maria Teresa Gutierrez-Wing, Ronald F. Malone, Biological filters in aquaculture: Trends and research directions for freshwater and marine applications, Pages 163-171,
6- Nafsika Karakatsouli, Sofronios E. Papoutsoglou, Georgios Panopoulos, Eustratios S. Papoutsoglou, Stella Chadio, Dimitris Kalogiannis, Effects of light spectrum on growth and stress response of rainbow trout Oncorhynchus mykiss reared under recirculating system conditions, Pages 36-42
7- Steinar Skybakmoen, Sten Ivar Siikavuopio, Bjørn-Steinar Sæther, Coldwater RAS in an Arctic charr farm in Northern Norway, Pages 114-121,
8- Sten Ivar Siikavuopio, Steinar Skybakmoen, Bjørn-Steinar Sæther, Comparative growth study of wild- and hatchery-produced Arctic charr (Salvelinus alpinus L.) in a coldwater recirculation system, Pages 122-126,
9- Steven T. Summerfelt, Mark J. Sharrer, Scott M. Tsukuda, Michael Gearheart, Process requirements for achieving full-flow disinfection of recirculating water using ozonation and UV irradiation, Pages 17-27
10- Sylvain Gilles, Gérard Lacroix, Daniel Corbin, Ngansoumana Bâ, Carla Ibañez Luna, Jacob Nandjui, Allassane Ouattara, Ousséni Ouédraogo, Xavier Lazzaro, Mutualism between euryhaline tilapia Sarotherodon melanotheron heudelotii and Chlorella sp.—Implications for nano-algal production in warmwater phytoplankton-based recirculating systems, Pages 113-121,

Creating self to find self

Ice breaker speech (My first speech at Toastmasters Club)

Respected Toastmaster, ladies and gentleman good evening!

The Turks from Azerbaijan can’t pronounce the sound “K”. They pronounce “K” as “Ch”. For example they call Pakistan as Pachistan and this aspect of Azerbaijani Turks were a source of amusement for fifth graders. Our science teacher was an Azerbaijani Turk and students were listening carefully to him and were making fun of them after class by repeating his words. This Turkish teacher attracted me. Unlike my class fellows I didn’t attracted to his pronunciation but to his world perspective.

I was busy sketching that a voice made me come out of myself, “What are you creating Khudadad?” It was my Turkish teacher that was looking to my sketch for long but I didn’t notice him until he didn’t ask me. I was speechless at the moment but he liked my sketches. I was always hiding my sketches from my teachers because they were always either too abstract or they were just caricatures. The word, “creating” from my Turkish teacher, the same teacher who all making fun of him, had changed my perspective about myself.

I was no more an individual to fit in anything. I was always wanted to change everything by recreating them. I was always in hot debates with my friends on every subject. I remember a debate that we had on theory of relativity. We didn’t realize that our discussion is so loud that our it is disturbing the conversations of other people around us. A young student came to us and while putting both of his palms together requested us, “Sir! Please let theory of relativity live one more day. Don’t kill it today.” We laughed and ended our discussion. The closest among my likeminded friends was my youngest uncle. We were mining gypsum from near mountain to make clays for our models. We built a small furnace to melt down aluminum and plastic to create our models. We were making casts from different materials to pour into our molds. We were wandering around markets of spare parts and second hand tools for suitable parts into our designs. We were trying to recreate everything from clothing to buildings to sports to philosophy to whole society. We want to change everything and every potential idea was attracting us. We piled up large and diversified range of books on different topics from philosophy to rocket science. Certainly we liked and moved by personalities some of whom people don’t like great Khan Genghis Khan, Lenin, Mao, Socrates, Dr Iqbal, Mir Damad, Enrico Fermi, Robert Oppenheimer, Adolf Hitler, Mussolini, Lincoln, Henry Ford, Michael Faraday, Charles Darwin. We liked these personalities because they were revolutionary figures in their disciplines and areas irrespective of the results and impacts of their struggles.

As we were doing our experiments, reading and debating we realized that, it is not easy to recreate everything as we were thinking so I started to change my attention from sketching and making models to philosophy. Playing with ideas was relatively easy so I started to create my own philosophy and it was the dividing lines between me and my friends. I did not know as we were growing our interests were also diverging and more than that we were selecting different fields. I chose geology and my friends’ chemistry. I became Science teacher and then lecturer of Geology and again changed my subject to paleobiology. The result of this all struggle came up in form of a book and two more books that I will publish them in summer.

Ladies and gentle man!

There were a lot of individuals who influenced me in different manners but four men in human history influenced more than others. I am influenced by commitment of Socrates to truth, by commitment of Genghis Khan to his people, by commitment Einstein to imaginations and by commitment of Charles Darwin to nature. It is me Khudadad, Laugh please.......................

Testing Natural Selection

Natural selection is almost 150 years old now.... and this long life, in the age of massive scientific investigations...is enough for strength of a mechanism or a theory. Despite the strength of N.S, nothing is ultimate in Science and Scientists are always skeptic....., even of their own works. It is how Science works? ...On other hand we have witnessed that Science has taken the lead in using the "reasoning" in human life, from poor Philosophy (until we see the resurrection of Philosophy...by the urgent needs that are coming from misuse of technologies and messes that have human compiled in their societies)..... Though I am new in world of evolutionary studies but I was always skeptic about Natural Selection. Why scientists don't use Physical mechanisms, Chemical mechanisms and Biological mechanisms that are more specific and empirical rather than natural selection that seems more philosophical and hence a lot of interpretations of it could come and cause a lot of controversies and conflicts. It seems that natural selection is just an interpretation of events rather than facts (There is no unit of natural selection. Natural selection occurs at gene level (transposons), cell level (cancer cells), individual levels(prey-predator relationship), group levels (social organisms like ants and bees) and selection at taxonomic levels (extinctions of Dinosaurs, trilobites, etc). It is called multilevel selection).

Let's have a look on commonly practicing definition and approach to natural selection. Futuyma (Douglas J. Futuyma, "Evolution" 2nd Edition, page; 283 ) writes,
"Natural Selection can exist only if different classes of entities differ in one or more features, or traits, that affect fitness..."

Defines fitness as,

"The fitness- often called the reproductive success - of a biological entity is its average per capita rate of increase in numbers. When we speak of natural selection among genotypes or organisms, the components of fitness generally consists of (1) the probability of survival to the various reproductive ages, (2) the average of number of offspring (e.g., eggs, seeds) produced via female function, and (3) the average number of offspring produced via male function. "Reproductive success" has the same components, since survival is a prerequisite for reproduction"....Sexual selection....

His actual definition of natural selection, "...Any consistent difference in fitness among phenotypically different classes of biological entities..."

If you carefully read from existence of natural selection to fitness and then definition of natural selection, it is all about three biological phenomenon, existence of variation and the survival and reproductive successes of organisms............very visible and easily measurable component... That is plus side but the problems come when we measure these components they become independent the abiotic factors that rule them.....

Molles (Manuel C. Molles Jr. "Ecology; concepts and application" 4th Edition, page 255) provides some examples that how environmental fluctuation control birth rate ( reproductive success) and death rate (survival),

"Sizes of populations fluctuate in terrestrial, as well as aquatic, environments. Some of the most variable terrestrial populations are found on the Galapagos Islands. The sizes of populations on these islands vary a great deal because they are subject to exceptional environmental fluctuations. Much of this fluctuation is produced by a large-scale climatic systems commonly called El Nino. El Nino warms the waters around Galapagos Islands and brings higher than average rainfall once or twice each decade. This increased rainfall stimulate germination and growth of plants. These plants produce abundance of seeds upon which Galapagos finches depend for food. In response to increased seed production, the size of finch populations can increase several folds in 1 year. However, these same populations are also exposed to periodic droughts. During droughts, which can be severe, both plants and finch population decline dramatically. Again whether in sea or on land, populations are dynamic."...........

Studies of decline and explosion of populations over long period of times is main way to study variation in population. Otherwise, measuring variation is making abstract notions out of the context interactions of biotic and abiotic interactions.....

To test this hypothesis we compare Natural Selection with an another hypothetical mechanism "Escaping competition". According to this mechanism, organisms try to be energy efficient and they tend to conserve their energy for main characteristics of life, like reproduction, growth, movements and socializations etc. (We use abbreviations like NC for natural selection and EC for escaping competition).

1. Artificial Selection:

NC: Natural selection is a biological process that is stretched for billions of years so human don't have a chance to observe it. But still there is artificial selection that is provoiding a good analogy to understant the natural selection. Human have domesticated cattles, fishes, dogs, horses, birds and have produced generations of these animals with desired traits over thousands of years. If human can change the animals and produce animals with desirable traits what about natural selection that works for billions of years?

EC: Two aspects of artificial selections is very important to note. Human have domesticated organisms to get energy (food, fuel), use for transportation (save energy) and amusements (escape competition/relax). Secondly, human didn't developed these desirable traits by competitions among these organisms but by separating them or making them escape out of competition.

Food for thought: If artificial selection is an analogy to natural selection then why human is much concerned about invasive species. Let local species compete with invasive species and desirable traits develop. But we human disagree and make laws and strong monitory policies to prevent local species from invasive species. Invasive species destroy habitate, introduce new diseases and have more tolerance to factors that local species are intolerant.

2. Camouflage

NC: On the page 84, Chapter IV, of the "On the Origin Of Species" Darwin writes, " When we see leaf-eating insects green, and bark-feeders mottled grey: the alpine ptarmigan white in winter, the red grouse the color of heather, and the black grouse that of peaty earth, we must believe that these tints are of service to these birds and insects in preserving them from danger. "
Camouflage is not limited to the same color as of your environments to escape predation but any tactics that save from predation could be entitled under camouflage. A unique example that Carl Sagan used is Samurai crab (Heikegani), a crab native to Japan that has a face of Samurai on its carapace. According to Carl Sagan this adaptation is the result of natural selection. As fisher men didn't eat the Samurai crab so adaptations favored against those of crabs without Samurai face.

Image source:
http://img254.imageshack.us/img254/9836/genji20crab20faceqjprevzk6.jpg

EC: Organisms camouflage to escape competition. Competitions occur within species and camouflage is not to compete with each other but as Darwin says preserving them from danger. Escaping predation is a mechanism that evolution favors and this observation is consistent from Darwin, himself to our time.

3. Reproduction

NC: Organisms produce more offspring each generation that possibly could survive.
EC: From fishes which produce thousands of eggs in spawning season to lizards that lay tens of shell protected and to pouch mammals that give birth to a child and to human which also give birth children we see a decrease in mortality of offspring as organims become more evolved. In case of human in becomes more evident. In advanced countries there is less mortality rate in infants and fewer children per couple than backward countries where infant mortality is more with more children per couple. Hence evolution favors less offsprings.
NC:

External Link for further readings:
1- http://en.wikipedia.org/wiki/Heikea

(This knol was part of my effort to rethink evolution and as is evident. not yet complete)

Mongolian Spirit and Hazaras

Introduction

Hazaras are the largest Mongolian population outside of the Mongolia. Hazaras are also called Turko-Mongols or Persianized Turks. It all comes fit to describe Hazaras because no one can delineate among Mongols, Turks, Tartars, Uyghur and other tribes living the vast steppes, mountain ranges and Tundra of central Asia. The nomadic life styles and alliances during wars mixed these nations to a degree that clear distinction is impossible. The current divisions based on the nation states, like Uzbekistan, Turkmenistan, Kyrgyzstan, Mongolia,…… and possibly Hazarajat is more geographical nationalities. Truly they belong to a single civilization, known as Altaic Civilization. The Altaic civilization is a basis of future regional alliance like European Union, ASIAN.

Before analyzing the Hazaragi culture, political, social and economical structures, it is necessary to know the historical spirits that they have inherited from their ancestors. One should be careful in applying these spirits into modern Hazara society because Hazara society is very dynamic and changes frequently. Today's Hazaras unlike their Shaman ancestors are dominantly Shia Muslim however, one cant ignore the links and openess of Hazara spirit with nature.

Mongolian Spirit:

1. Mongolia is an isolated, land-locked country in the heart of central Asia. In north, vast Siberain forests, in south, vast Gobi desert and in west, two mighty mountains Altai and Tien Shen isolate Mongolian Plateau from the rest of the world. Exterme cold and hot weathers and harsh landscapes of desert, steppe, forests and mountains make it inhospitable. Despite these geographical disadvantages and natural barriers, Mongol spirit blew westward, southward and northward to unite all nations by first globalization.

2. Shamanism was the core of Mongolian world perspective. The sky, Sun, stars, mountains, rivers and simply nature had spirits that Mongols were praying and talking to. The highest among spirit was the spirit of sky that is over everything. Sky and nature accompany anywhere you go. It was the basis of the global thinking in Mongolian mindset.

3. Though Mongolians embraced all religions and their followers but they had their own interpretations of these religions based on sprits of nature.

4. The nature was leading their movements (nomadic life style) and wealth and knowledge were their main attraction. There were no natural barriers for them. The only thing that stopped them was poverty and ignorance. They conquered every kingdom with wealth and knowledge and stopped where these two things were absent.

5. Color and race were not important to Mongols. What was important to them was loyalty so they included people from all races into their family that they annexed to Mongolian empire.

Mongols tried to create a single nation out of all races. The Turko-Mongol people living in central Asia, Urdu or Hindi speaking people in South Asia (India and Pakistan) and Hazaras living in Afghanistan, Pakistan, Iran and also in scattered populations in Central Asia and Australia is examples of new nations out of these efforts.

There were three ways that people become part of Mongolian family. Firstly called, Quda, means by marriage, second was by sworn brotherhood which is called, Anda and thirdly by friendship which is called, Nokor. So the doors of Mongolians were open for all who were wishing to be part of it.

6. Skills and meritocracy was the core in the Mongolian empire. In their attacks they were looking for skilled and educated men and women and were using their skills and benefit the empire. People with skills and knowledge were promoted to the higher ranks, irrespective of their race, color and religion.

7. Xenophobia was alien to Mogolians. It was the main reason that a small nation of Mongolia could conquer the populous nation of China and vast lands of central Asia and Middle East. The numbers of soldiers from other nations outnumbered the actual Mongolian soldiers in Mongolian army.

The spirit of Hazaras:

There are few books and articles about social structures and behaviors of Hazaras which, when I study, as a member of Hazara nation, looks totally alien to me. This made me write down the real spirit of Hazaras so the researchers and writers interested in Hazara culture, social, economical and political structures have a better understanding when analyzing Hazara society.
Main confusions about Hazaras:

1. The collapse of social, economical and political structure after the 1885 invasion of Hazarajat by Afghan incursion, Hazaras went to the fringe of political, social and economical life of Afghanistan.

In fact, it was the collapse of Hazara society to push them to bottom of the social life among other nations but the intentional isolation of Hazara society, denial of education, trade and participation in politics that made them out of an active role in Afghanistan. We observe the significant educational and trade achievements of Hazara society in Baluchistan province of Pakistan at the same time that Hazaras were living in at fringe Afghani society.

2. It is the 1885 invasion of Hazarajat and following oppression of Hazaras that Hazaras migrated to Iran, India at that time and later on to Pakistan, Central Asia and recently to Europe, Canada and Australia.

Hazaras, with a spirit of globalization that they have inherited from their Buddhist and later on Mongolian ancestry were never stopped moving across the borders in search of wealth and knowledge. Poverty and ignorance is the only barrier for movement of Hazaras. It was Mongolian who started the process of globalization by connecting Asia, Africa and Europe and since those times that never ceased movements though their movements reduced by new political, economical and military developments across the world.

3. Hazaras is an ethnic group.

Hazaras are not an ethnic group. Hazaras is a nation that is not based on ethnicity. As I mentioned in part of Mongolian spirit, that they were including people of all races in the empire into Mongolian family to make them part of Mongolian nation. This process is not stopped among Hazaras. In Hazarajat you will find Baluchis (In Kijran), Pashtoons (Members of Yusufzai tribe), Qizilbash, Uzbeks, shi'it Tajiks as part of Hazaras nation. The same process is in Quetta of Baluchistan province. People across Pakistan, from Kashmir, Gilgit, Baltistan, Parachinar, Kurram Agency, Peshawar, to Punjabis, Sindhis, Baluchis, to Zabulis and Kandaharis are becoming part of Hazara society and Hazara nation. Hazaras is a historical spirit that embraces multiculturalism and never ceases nation building process. Hazaras have still preserved the Mogolian concepts of Quda (relationship by marriage), Anda (realtionship by sworn brotherhood) and Nokor (relationship by friendship). When a girl and boy marry their parents call each other Quda-ghu which means members of family and it is still alive in Hazaragi culture even in Quetta, Pakistan. Similarly, Hazaras have still preserved the traditions of sworn brotherhood and sisterhood and Hazaras are known in their loyalty in friendship across the cultural, religious, lingual and national boundaries.

4. Hazaras have a historical hatred and rivalry to Pashtoons.

It is the largest confusion about the Hazaras. Xenophobia is alien to Hazara society. Hazaras are massacred, their lands are confiscated, they forcefully migrated. Hazaras have been facing the worst kinds of discriminations that still continues. Ceratinly these discriminations cause bitter feelings among Hazaras but it is not the result of Xenophobia. People confuse the feelings resulted from discrimination and xenophobia. Discriminations is unacceptable to Hazaras as well as Xenophobia.

5. Hazarajat is a land-locked, isolated and composed of inhospitable narrow valleys that is not a viable country. The people were looking the same way to Mongolia before Genghis Khan. The Chinese emperror mocked Genghis Khan by saying that China is as vast as Ocean.


Note: This article is still under construction. Your comments, suggestions and critics are welcome.

Climate change and risks of extinction

Background:

Extinction is as important in biology as mortality rate. There are two kinds of extinction that have been identified in biological history, mass extinction and background extinction. Usually the focus of studies is mass extinction; however ecologists are more concerned about background extinction that is an ongoing process. There are several questions in extinction that is needed to be explored in conservation of species. Is extinction selective or not? What aspects of biological spheres are under selective pressure of extinction? And why do species extinct? There are several kinds of extinction selections like introduction of invasive species, Habitat loss, over-exploitation, climate change and pollution. Here in this knol, I have selected Climate change as it is affecting all biomes and its rates are rapidly increasing. I have highlighted the areas that are currently under risks of extinction due to climate change pressures ranging from Polar Bears, Penguins, Amphibians, Royal Tiger and Pollinators.

I. Introduction:

It seems that the two processes of speciation and extinction are balancing each other, however when we look at numbers of both processes, it creates doubts. Though fossil record is not complete but it is grossly estimated that there have been 4 billion speciation, in evolutionary history of life, out of which only 4 millions species are alive today. It means 3.996 X 10⁹ species have extinct in evolutionary history of life (D. Raup, 1991). In 1994, Raup in his famous paper, “The role of extinction in evolution”, which is published in National Academy of Science, argued that ignoring extinction for an evolutionary biologist is as for a demographer to ignore mortality rate. Whenever there are discussions on extinction, people usually refer and think to mass extinctions, especially big five mass extinctions. Table. 1, compares big five mass extinctions.
The figures of extinctions in big five mass extinctions seem impressive as they are occurring in short time intervals and eliminating form 75% to 95% of existing species. Though extinctions in these events are impressive but they are collectively making only 4% of the total extinction over past 600 million years.

David Raup (D. Raup et al, 1994) has calculated the extinction rate and found that the extinction rate is 25% per million and mean species duration is 4 million years. The comparison of extinction by mass extinction and background extinction is important because mass extinction are usually considered as a result of sudden changes in environment but the background extinction is the result of constant changes in environment. Hence background extinction is important for ecologist to understand.

Some published estimates of mass extinction (Different authors differs in their estimates based on their subjects)

(1) 15 million years : Raup, D.M. and J.J. SEPKOSKI, JR. 1982. Mass extinctions in the marine fossil record. Science 215:1501-1503

(2) 10 million years : HOUSE, M.R. 1967. Fluctuations in evolution of paleozoic invertebrates. Pp. 41-54. In HARLAND, W.B., C.H. HOLLAND, M.R. HOUSE, N.F. HUGHES, A.B. REYNOLDSS, M.J.S. RUDWICK. G.E. SATTERTHWAITE, L.B.H. TARLO, AND E.G. WILEY, (eds.), The fossil record. The Geological Society of London: london.

(3) 8 million years: FARSAN, N.M. 1986. Fransian mass extinction - a single catastrophic event or cumulative? Pp. 198-197. In Walliser, O.H. (ed.), Global Bio-Events: a critical appraoch. Lecture Notes in Earth Sciences 8. Springer-Verag: Berlin.

(4) 7 million years: McGHEE, G. R., JR. 1982 The Fransian-Famennian extinction event: a preliminary analysis of Appalachian marine ecosystems. Geological Society of America Special Paper 190:491-500.

(5) 3 to 5 million years: COPPER, P. 1984. Cold water oceans and the Fransian-Famennian extinction crisis. Geological Society of America Abstracts with program 16:10.

(6) 1 million year: ZIEGLER, W. 1984. Conodonts and Frasnian/Famennian crisis. Geological Society of America Abstracts with program 16: 73.

(7) 0.5 million year: SORAUF, J.E. AND A.E.H. PEDDER. 1984. Rugose corals and the Frasnian- Famennian boundary. Geological Society of America America Abstracts with program 16:64.

After D. Raup, et al. 1994

Once it is established that background extinction is more important than mass extinction then the second question arises that is extinction indifferent or selective? If it is selective then which group of organisms is at greater risks of extinction?

Paleobiologists have tried to establish a link between selectivity of extinction over taxonomic, specific traits and species levels. There is quiet small difference in selectivity across taxonomic level, however there is strong selectivity for specific traits like, widespread geographical distributions, body size along with long generation size. Jablonski, (Jablonski, 1986) showed that in background marine mollusks with planktonic larvae survive longer than those develop from egg. Mollusks with planktonic larvae have greater dispersal abilities and as a result higher survival capabilities to stresses than species with limited dispersal capabilities. Similarly there are enough evidence exists of extinction of organisms with large body sizes like, Dinosaurs, ammonites, eurypterids, mammoths, mastodons and rudist clams(LaBarbera et al, 1986). Simpson have also suggests that mammals with long generation times suffered greater extinction in latest Pleistocene because natural selection could not operate quickly enough for adaptation to changing climatic conditions.

Now that it is established that extinction is somehow selective then, a third and more related question come arise and that is why do species become extinct? There are three points of views among evolutionary biologists mostly based on the philosophical predisposition,

i. Extinction occur because of inferior adaptations(Invasive species replace native species)

ii. Bad luck (Habitat loss due to volcanism, continental drift, climate change and sea level rise)

iii. The red queen hypothesis of L.Van Valen, “It takes all the running you can do just to stay in place” Or antagonistic interaction: If one organism improves adaptation, it forces other related organisms to improve adaptations. For example, if one organisms improve a trait that make it able to successfully avoid predators, then the natural selection pressure increases on others and forces them to improve their traits.

Now, that we have established from life history that constant extinction is more important than sudden extinctions, there is some selectivity in extinction and there are different causes that organisms go extinct so let’s see the current trends of extinction under anthropogenic climate change.

II. Climate Change?

We can be skeptic about the climate change controversies that arise from time to time but still there are certain areas that there is a common census. Vitousek has identified three such areas that are well documented and is beyond the doubt. The first is increasing concentration of the carbon dioxide in the atmosphere, second is alteration in the biogeochemistry of nitrogen cycle and third that is ongoing land use/land cover change (Vitousek et al,. 1994). Though Vitousek didn't include the human in his list but the human population growth is beyond doubt both in numbers and in effect on the climate so we can include it as fourth factor.

Though climate change is not new for current biological populations and they have seen the fluctuating glacial, interglacial and little ice age for last since Pleistocene period. However the current anthropogenic climate change is different from several perspectives. In past climate changes, human weren't in direct competitions for same resources to natural world, the rate of climate changes were not rapid as today, species had space for movements in response to climate change. Species had not lost genetic diversities to the rates they are losing due to massive hunting, introduction of invasive species, habitat loss, introductions of pests, herbicides and pollution and human barriers in their routes of migration, etc.

III. Why we should care about global Change

The lists of impacts on human by the human caused climate change are very long. I would like to mention a few of them so it make us realize that, why anthropogenic climate change should be a matter of concern for us. Climate change may affect the ecosystems which provide essential services to human like, key nutrient cycles (Carbon cycle, Nitrogen cycle), maintaining air quality, food, fuel, raw resources for numerous industries, medicines, new compounds, pests and diseases, etc. The ecosystem services is not limited only to physical, chemical and biological services but also provide aesthetic, tourisms, cultural and spiritual services. Following we give some reports from UN and WWF, so we could sense, how much the issue on hands is serious.

A. Millennium Ecosystem Report (2005);

Few important points related to biodiversity that is notable in the report of Millennium Ecosystem Report (2005) under title of, "Ecosystems and human well-being" is as follows,

1. Figure 3.10 under title of "Main direct drivers", has compared the impacts of habitat change, climate change, invasive species, over-exploitation and pollution (nitrogen, phosphorus) on biodiversity. This comparison reveals that the impact in each biome including forest (boreal, temperate, and tropical), dry land (temperate grassland, Mediterranean, tropical grassland and savanna, desert), inland water, coastal, marine, island, mountain, island, mountain and polar environments are compared. It is interesting to note that the impact of climate change vary across the biomes from high to low but there is very rapid increase of the climate change on all biomes.

2. Figure 1, of this report shows that the rate of extinction is increasing with passing times. Figure 1, under title of, "Species extinction per thousand species per millennium" the rate of extinction of almost all major organism have compared based on fossil record (for distant past), known extinction (for recent past) and modeled prediction for future extinction. Fossil record shows for every thousand mammal species, less than one went extinct every millennium. Current extinction rate is up to thousand times higher than the fossil record. Projected future extinction rate is more than ten times higher than current rate.

3. Table 2.2. Trends in the Human Use of Ecosystem Services and Enhancement or Degradation of the Service around the Year 2000,

a. Global: In the middle of last century terrestrial ecosystems were turned from a net source of Co2 into a net sink. The land cover use increasing albedo effect, which contrary to Co2 emissions caused the world temperature do not increase much due to greenhouse effect.

b. Regional: Though land cover use have affect local and regional climate in both positive and negative directions, however the negative impact is higher like tropical deforestation and desertification have overall reduced the rainfall (humidity and temperatures are directly proportional).

c. Pollination: Globally the population of pollinators has declined except of Antarctica, which lack pollinators. The decrease of pollinators have caused decline in number of seed and fruit productions. The decline of pollinators has also affected the reproduction of some rare plants.

B. Living Planet Report 2008:

Several points that World Wildlife Fund in its 2008, "Living Planet Report 2008" point out is eye opening. The living planet index shows that over the past 35 years alone the Earth's wildlife populations have declined by a third. Human global footprint now exceeds the world's capacity to regenerate by about 30 per cent. For the first time in recorded history, this past summer (2008) the Arctic ice cap was surrounded by open water-literally disappearing under the impact of our carbon footprint. The Living Planet Report 2008 tells us that more than three quarters of the world's people live in nations that are ecological debtors- their national consumptions has outstripped their country's biocapacity.

IV. Risks of extinctions:

According to The International Union for Conservation of Nature (IUCN)’S 2004 Red List, 15,589 species of animals and plants are threatened to extinction in near future due to human activity – one of these human activities is human caused climate change. The order of threatened species is amphibian species 32% (one in three), mammal species 24% (one in four), bird species 12% (one in eight), Conifer species 25% (one in four) and Cycads 52% (IUCN Red List,2004). This high rate of extinction as also compared to five mass extinction in geological times and it is why sometimes referred as 6th mass extinction but it is some sort of overstatement as human is aware of their impacts and working for the conservation of threatened species which is though controversial but is progressing.

A. Arctic Polar Bears

Cold regions are very sensitive to temperature rise. Arctic is believed to be twice and thrice sensitive to climate change than other parts of the world. Organisms that have adapted to these cold regions are also sensitive to temperature rise. In Arctic region, Polar bears is thought to be threatened by climatic warming, esp of warming of air in late spring (April-June). As the sea ice melts in this time period, it limits the movements of bears and hence declines the chances of mating and hunting. Derocher has concluded that polar bears are unlikely to survive (Derocher, A.E., Lunn, N.J., Stirling, I., 2004. Polar bears in a warming climate. Integr. Comp. Biol. 44, 163–176) however, Dyck and co-authors contradict with this view and they think that there is no climatic warming since last 70 years around Hudson bay area and what others have considered as warming is part of arctic variability (Dyck et al, 2007).

Image source:http://legalplanet.files.wordpress.com/2009/05/polar-bear.jpg

B. Antarctic Penguins:

Like Polar bears of arctic, the Penguins of the Antarctica is also threatened to extinction. According WWF Antarctic Climate Change Focal Project (ACCFP)'s report, "impacts of 2C global warming on Antarctica penguins", 50% of the colonies of the iconic Emperor penguin and 75% Adelie penguin colonies face marked decline or disappearance if global temperature is allowed to rise 2°C above preindustrial levels.

C. Amphibians:

The hotspot group is amphibians that are concerned about mostly due to their current rate of extinction. Pound reports extinction and declines of many cloud-forest amphibians on a mountain in Costa Rica (Pounds et al.1999,2005). Malcolm has compared the current rate of mass extinction of amphibians with their background rate of extinction and found that Amphibian’s current rate of extinction is 211 times of their background extinction (Malcolm et al., 2007). Stuart estimates that almost a third of amphibians are threatened with extinction (Stuart et al., 2004) and Pounds considers one of the causes among others is climate change (Pounds and Crump, 1994; Pounds et al., 1999).

D. Sundarban Mangroves and Royal Tigers:

Panthera Tigris is the only tiger species that have adapted to live in Mangrove forest. The Mangrove forest of Sundarbans is the home of this Mangrove tigers. Over 10,000 Km2 of Sundarban, 6000 Km2 is in Bangladesh and the rest is in India. This mongrove forest which lies on Southern fringe of Ganges Delta supports a rich fauna and flora. Rahman (Rahman et al., 2000) reported that the Mangrove forest which is composed of 401,600 ha in land and remaining 175,400 ha, under the water in the forms of river, canals and creeks of width varying from a few meters to several kilometers supports different species of about 334 plants, 120 fishes, 35 reptiles, 270 birds and 42 mammals. The Sundarbans is the only habitat of the famous Royal Bengal Tiger and estuarine crocodile.

Loucks and colleagues (Louks et al,. 2010) of World Wildlife Fund estimated that with a 28 cm rise above 2000 sea levels, remaining tiger habitat in Bangladesh’s Sundarbans would decline by 96% and the number of breeding individuals would be reduced to less than 20. They Assumed that current sea-level rise predictions and local conditions do not change, a 28 cm sea level rise is likely to occur in the next 50–90 years. If actions to both limit green house gas emissions and increase resilience of the Sundarbans are not initiated soon, the tigers of the Sundarbans may join the Arctic’s polar bears (Ursus maritimus) as early victims of climate change-induced habitat loss. It is noticeable that globally, sea level has increased by 1.8 ± 0.5 mm year−1 from 1961 to 2003, but 3.1 ± 0.7 mm year−1 from 1993 to 2003 (Bindoff et al. 2007).

Image Source:http://www.earthweek.com/online/ew070511/ew070511c.jpg

E. North Western Hawaiian endemic and endangered species:

Hawaiian Monk Seal is one of the rarest marine mammals in the world. There are only 1300 individuals mainly in the 6 NWHI subpopulations (Carretta et al, 2006). Hawaiian Monk Seal is listed as endangered species under US Endangered Species Act 1973.

Another threatened species that is listed in US Endangered Species Act is Hawaiian green sea turtles. Although the range of Hawaiian green turtle covers the entire Hawaiian archipelago but French Frigate Shoals, one of the NWHI atolls is the home for the 90% breeding female nest. The sandy beaches of these islands provide protection from waves and sharks and an easy access to ocean (Westlake and Gil martin, 1990).

Adding to list are the vulnerable Laysan (phoebastria immutabilis) and endangered black-footed albatross (P. nigrispes), according to IUCN, whose nesting occur entirely in NWHI (Harrison, 1990). The NWHI are the habitat for some 14 million sea birds of 18 species (Harrison, 1990). NWHI also have endemic species including 4 land bird species, 3 terrestrial species, 12 plant species and over 60 species of terrestrial arthropods (Canont et al, 1984).

As we mentioned earlier the sea level is rising. Sea level rose up around 15 cm in twentieth century (Ruddiman, 2001) because of melting of ice at poles and glaciers and also thermal expansion of the ocean.

F. Coral Reefs:

The most evident effects of the rapidly increasing levels of Co2 in the atmosphere is increase in average global temperature, rise in sea levels and acidification of oceans. The Co2 is dissolvable in water and oceans have dissolved 25% (2.2 Pg C/year) of Co2 that is emitted as a result of human activity. The Co2 dissolved in ocean makes carbonic acid which dissolve the coral reefs (Coral reefs are made of up carbonate shelled organisms and their deposits and carbonate fizz out in dilute acid). This reef degradation as a result of acidification along with decline in herbivorous fish and nutrient loading are causing coral reefs shift to algal dominated systems.

G. Global vegetation distribution:

In 1967 the botanist, R. L. Holdridge sketched the global distribution of plant communities solely based on the climate considering that temperature and rainfall is the dominant factors relative to soil composition and altitudes, acidity etc (though these factors are important determinants in local distribution of vegetation). Holdridge's scheme is known as Holdridge life zone model and it is still widely used especially in comparison with other models to determine or predict the effects of climate change on the vegetative distribution.

After Holdridge 1967
Image Source: http://en.wikipedia.org/wiki/File:Lifezones_Pengo.svg#filelinks

Though the effect of the climate change on the distribution is not fully understood but still several factors are evident. The current global warming is largely caused by green house gases emitted by human activity. The most important green house gas is CO2. Vegetation is not only sensitive to warming caused by increasing concentrations of CO2 in atmosphere but also to CO2 itself as CO2 is one of the important nutrients. Concentrations of CO2 are especailly important for aquatic photosynthetic species and may cause eutrophication in lakes (if Nitrogen and phosphorus are sufficient).

H. Plant and insect interactions:

In 1998, Coviella and Trumble wrote a review paper under title "effects of elevated atmospheric carbon dioxide on insect-plant interactions" and they have listed the researches have done on specific plant-insect interactions. They have argued that there are limited researches available on this issue however it is certain that increased level of CO2 and temperature is species specific so it is expected to vary a lot across species. However it is evident that increased levels of CO2 favor C3 photosynthetic plants over C4 photosynthetic plants. This selective favorability of increased CO2 also affects insects’ dependant on the specific plants.

I. Phenological Changes and decline in Pollinators:

Plants, insects and birds are sensitive in certain times of their life history to temperature and humidity and also depend on each other’s life histories. Due climate change the plants tend to bloom earlier. This earlier blooming causes a mismatch between appearances of pollinators. The late arrival of pollinators (compared to early blooms of plants) cost pollinators with less food and plants with less seed. Decline in number of seed and pollinator insect which are food sources for birds, affect bird populations.

D. Inouye (Inouye et al, 2008) have linked several points to Phenological changes in Perennial herbaceous wildflower species at Rocky Mountain Biological Laboratory (Colorado, USA), a. timing of snow melt, b. snow cap size, and c. elevation. Date of snow melts are important to number of flowers in summer. Small snow caps lead to early blooming and risks of frost damage. He also found that difference of 12 meters in elevation resulted in 2 degree of Celsius difference and 37% frost damage to buds. The number of flowers and seed is very important as less flowers and seed results decline in populations.

J. Paleoecological studies;

Margaret Davis of University of Minnesota and her colleague, in a review paper in 2005 argued that Paleoecologists looked to evolution as a mismatch to climate change. "Evolution is too slow as compared to climate change so primary biotic response to climate change is not "adaptation", but instead (1) persistence in situ if climate remains within species tolerance limits, (2) range shifts (migration) to regions where climate is currently within the species' tolerance limits, or (3) extinction".

She argues that, all these processes are evolutionary responses which are accompanied by shifts in biotic ranges during climate change. The evolutionary responses of plants differs greatly as herbs response in decades and trees respond in centuries and millennia (Margaret et al,2005).

A series of populations of Lodgepole pine (pinus contorta), were progressively lossing alleles when migrating northward in Holocene in Western Canada as a response to climate warming. This allele loss is determined by help of allozymes (Cwynar and MacDonald 1987).

Trees show different levels of adaptation as a response to climate change, Scots pine (Pinus sylvestris) have adapted to diverse elevations and altitudes of Finland over past several thousand years. This area was covered with continental ice until mid-Holocene (Hurme et al.1997). While Introduced herbaceous species in North America and Europe show genetic variation in response to climate within decades or a century for example, Verbascum thapsus, Reinartz 1984, Daucus carota, Lacey 1988: Solidago sp, (Weber and Schmid 1998).

Short tailed albatross is listed as a vulnerable species according to ICUN red list because it is it still has a very small breeding range, limited to Torishima and Minami-kojima (Senkaku Islands) with approximate populations of 2500 individuals. Oslon and Hearty (2003) have reported based on their conclusion of possible extinction of short-tailed albatross (Phoebastria albatrus) colony during Pleistocene sea level rise in Atlantic ocean.

References:

Ainley, D., Russell, J. and Jenouvrier, S. 2008. The fate of Antarctic penguins when Earth’s tropospheric temperature reaches 20°C above preindustrial levels: www.panda.org/antarctica.

Baillie, E.M., Hilton-Taylor, C. and Stuart, S.N (editors) (2004). 2004 IUCN Red List of Threatened Species. A Global Species Assessment. IUCN, Gland, Switzerland and Cambridge, UK.

Colby Loucks · Shannon Barber-Meyer · Md. Abdullah Abraham Hossain ·Adam Barlow · Ruhul Mohaiman Chowdhury, Sea level rise and tigers: predicted impacts to Bangladesh’s Sundarbans mangroves, Climatic Change (2010) 98:291–298 DOI 10.1007/s10584-009-9761-5.

Coviella, C. and J. Trumble. 1999. Effects of elevated atmospheric carbon dioxide on insectplant interactions. Conserv. Biol. 13:700-712.

DAVID M. RAuP, The role of extinction in evolution, Proc. Nati. Acad. Sci. USA Vol. 91, pp. 6758-6763, July 1994, Colloquium Paper.

Laskar Muqsudur Rahman, The Sundarbans: A unique Wilderness of the world, USDA Forest Service Proceedings RMRS-P-15-VOL-2. 2000

LaBarbera, M. (1986) in Patterns and Processes in the History of Life, eds. Raup, D. M. & Jablonski, D. (Springer-Veriag, Berlin), pp. 69-98.

Margaret B. Davis, Ruth G. Shaw, and Julie R. Etterson, Evolutionary responses to changing climate, Ecology, 86 (7), 2005, pp. 1704-1714, Ecological Society of America.

Malcolm L. McCallum, 2007, Amphibian decline or extinction? Current declines dwarf background extinction rate, Journal of Herpetology, Vol. 41, No. 3, pp. 483–491, Society for the Study of Amphibians and Reptiles.

M.G. Dyck , W. Soon, R.K. Baydack , D.R. Legates , S. Baliunas, T.F. Ball e, L.O. Hancock, 2007, Polar bears of western Hudson Bay and climate change:Are warming spring air temperatures the ‘‘ultimate’’ survival control factor?, ecological complexity, 4 (2 0 07 ) 73 – 8 4.

Millennium Ecosystem Assessment, 2005. Ecosystems and Human Well-being: Biodiversity Synthesis. World Resources Institute, Washington, DC.

POUNDS, J. A., M. P. FOGDEN, AND J. H. CAMPBELL. 1999. Biological response to climate change on a tropical mountain. Nature 398:611–615.

Raup, David M. Extinction: Bad Genes or Bad Luck? W.W. Norton and Company. New York. 1991. pp.3-6 ISBN 978-0393309270

STUART, S. N., J. S. CHANSON, N. A. COX, B. E. YOUNG, A.S. L. RODRIGUES, D. L. FISCHMAN, AND R. W. WALLER. 2004. Status and trends of amphibian declines and extinctions worldwide. Science 306:1783–1786. 2005. Response to comment on ‘‘Status and trends of amphibian declines and extinctions worldwide.’’ Science 309:1999c.

Simpson, G. G. (1944) Tempo and Mode in Evolution (Columbia Univ. Press, New York).

Olson SL, Hearty pj (2003) probable extirpatio of a breeding colony of short-tailed Abatross (Phoebastria albatrus) on Bermuda by Pleistocene sea level rise. Proc Natl Acad Sci USA 100:12825-12829.

Vitousek. P.M., (1994), "Beyond global warming; Ecology and Global Change", Ecology, 75(7).pp.1861-1876.